Makassar, Purwokerto, Ambon, Manokwari, and partner campus networks in Indonesia.
Impact Story · ai-ready-asean
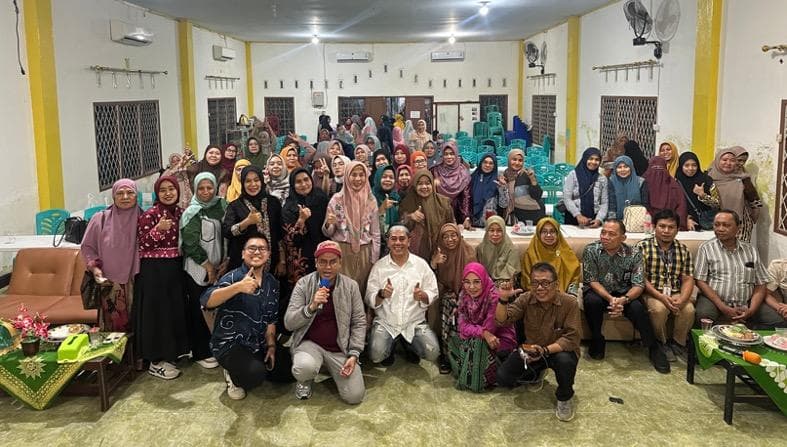
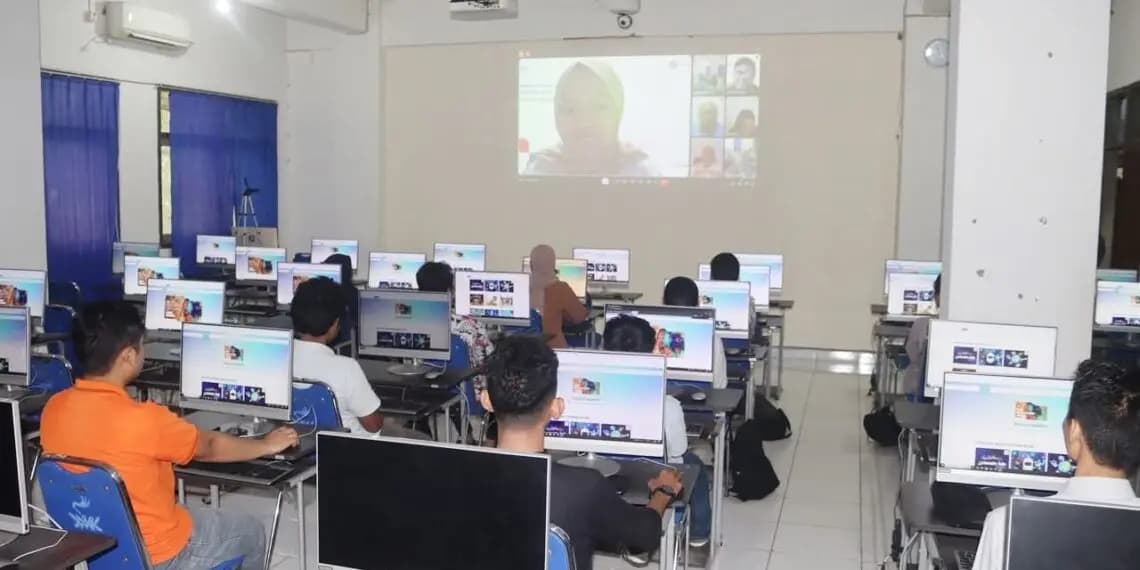
Campus Networks for Safe and Responsible AI Literacy
Problem. Many students are starting to use AI, but not all understand ethics, limitations, data safety, and productive use.
Intervention. Kaizen runs Hour of Code, AI Literacy, AI ethics discussions, and campus collaborations as an entry point for safer AI learning.
10+ schools and universities engaged1,000+ direct beneficiariesAI literacy and ethical technology-use materials